Projects
Table of Contents
Data Visualization
The Spread of COVID-19 in the United States
Using data from The New York Times and the GeoPandas python package, we can track the spread of the Coronavirus in the United States by county and visualizes the results. This animation shows the spread of positive cases from January 21, 2020 to June 21, 2020.
Inner Planetary Orbits in the Solar System
3D animation is a valuable tool in data visualization. Here, I animate the orbits of the four inner planets or our solar system. It was an invaluable exercise in both animating data and 3D plotting in Python.
Optimal Control
Stabilizing a Double-Inverted Pendulum System
I worked with a small group to find a way to balance the double pendulum above the cart by only exerting force on the cart. Our approach utilized the Linear Quadratic Regulator feedback controller to exert optimal control on the cart and stabilize the system. Read our project report for more information! Here are some examples of stabilization from different intial conditions:
Deep Learning
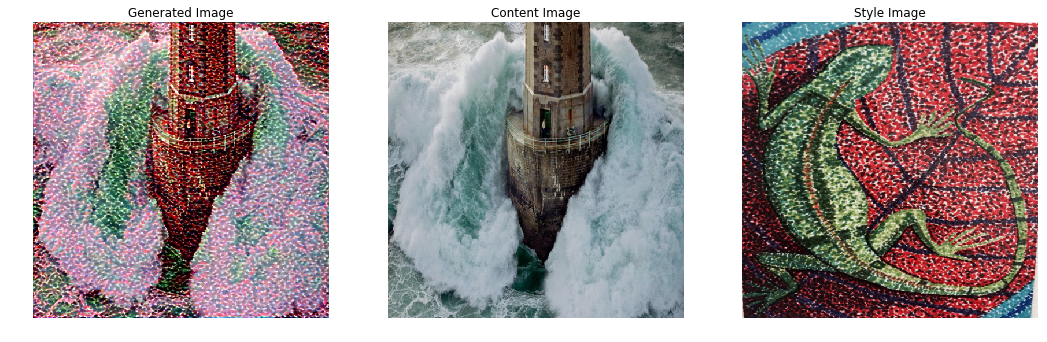
Style Transfer
As I explored interesting areas of deep learning, I came across style transfer. I used the VGG-19 Convolutional Neural Network model to fuse the style of one image with the content of another image. The results are a beautiful example of what can be accomplished with deep learning!
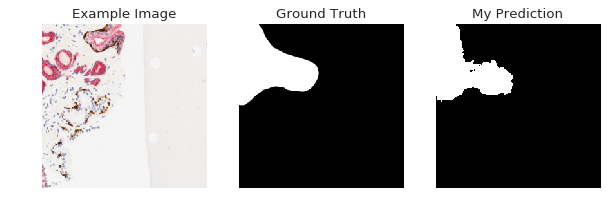
Cancer Detection
In this project, I created a PyTorch radiologist. I utilized U-Net architecture to develop and train a deep neural network who learned how to identify which areas of a picture are cancerous. The model performed well, ultimately being able to correctly identify cancer with over 95% accuracy on the validation set. In this image, we see a picture of skin cells, followed by the groun truth indicating where cancer is present in the picture, and then my model’s identification of the cancer.